U.S. economy grew at a 3.4% rate in Q3, led by inventories and equipment spending
The Commerce Department's first estimate shows a pickup from 2.2% in Q2. Exports fell, led by petroleum, while imports of capital goods rose.
Real U.S. gross domestic product grew at an annual rate of 3.4% in the third quarter, the Bureau of Economic Analysis said Oct. 29 in its advance estimate. Growth was 2.2% in the second quarter.
What drove it
BEA says the increase reflected gains in investment and consumer spending, partly offset by a drop in exports.
- Private inventories led the investment gain, mostly in wholesale trade and manufacturing.
- Equipment investment rose, led by information processing equipment.
- Exports fell, led by petroleum.
- Imports, which subtract from GDP, rose. Capital goods except automotive were the largest contributor.
- Federal nondefense spending reflected lower sales from the Strategic Petroleum Reserve.
Demand and prices
| Measure (annual rate) | Q2 2026 | Q3 2026 | |---|---|---| | Real GDP | 2.2% | 3.4% | | Real final sales to private domestic purchasers | 4.6% | 4.9% | | Gross domestic purchases price index | 5.6% | 3.0% | | PCE price index | 5.0% | 2.1% | | Core PCE (ex food and energy) | 3.3% | 2.5% |
Current-dollar GDP rose 5.6%.
Why freight watches this
Inventory building is freight. Goods restocked in warehouses and on shelves move by truck, rail and container. A quarter where inventories led investment points to stronger goods flows through the supply chain.
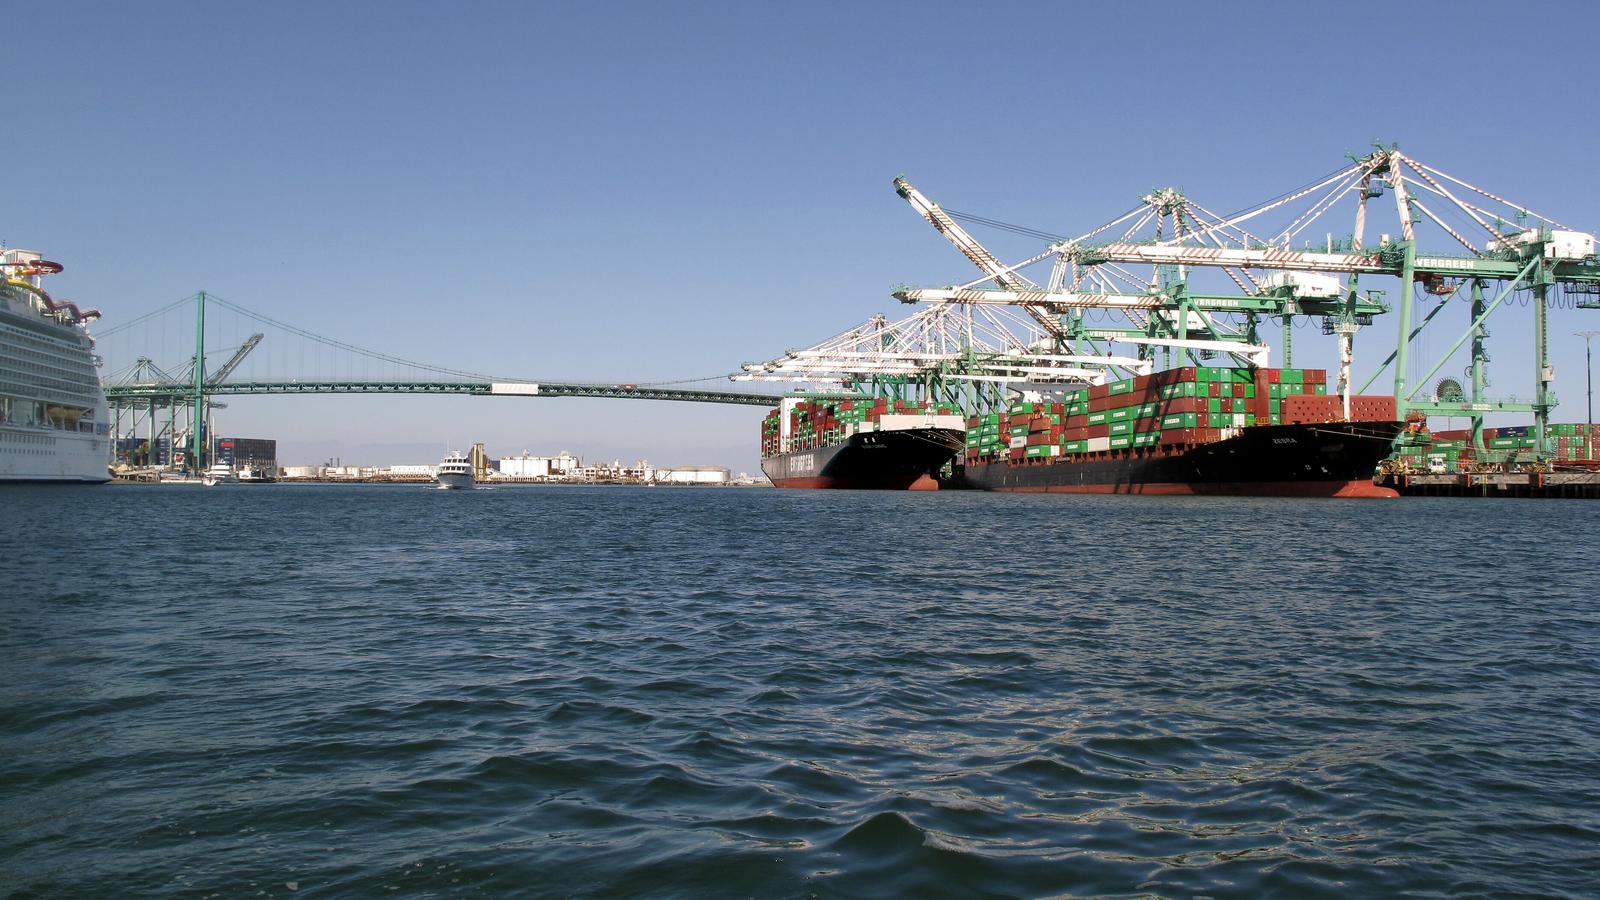
Rising imports of capital goods also mean more inbound containers and drayage at ports. Falling petroleum exports cut into outbound bulk volume.
Price pressure eased. The PCE index slowed to 2.1% from 5.0%.
Next
This is the first of three estimates. BEA's second estimate for the third quarter is scheduled for Nov. 25, 2026.