US container imports hit a record 2.67 million TEUs in October as East and Gulf Coast ports gain ground
China-origin volume rose for a fourth straight month, while average port transit delays at the 10 busiest gateways reached 6.3 days, about 50% above June.
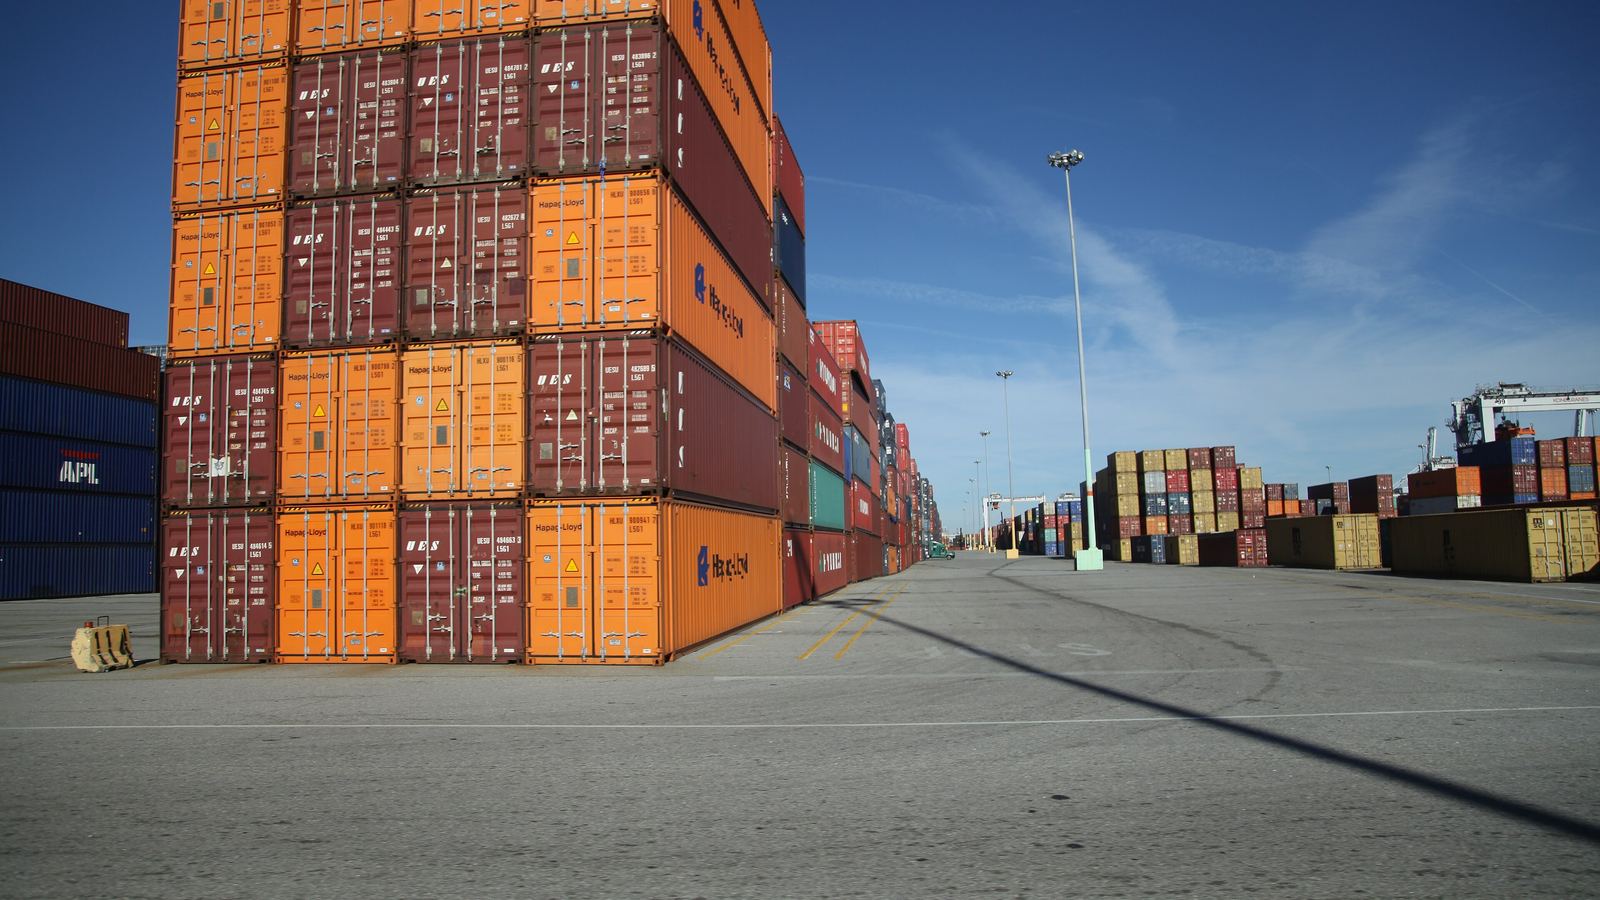
U.S. containerized imports reached 2,674,808 twenty-foot equivalent units (TEUs) in October 2026, the highest monthly volume on record, according to Descartes Systems Group's November Global Shipping Report, released Nov. 11.
That was 2.0%, or 52,343 TEUs, above the previous record of 2,622,465 TEUs set in May 2022. October volume was up 5.0% from September, 16.0% from October 2025 and 29.2% from October 2019. Through the first 10 months of the year, imports were up 2.3% from the same period of 2025, the second straight month in which year-to-date volume was ahead of last year.
China leads the gain
Imports from China rose for a fourth consecutive month to 987,805 TEUs, the highest since January 2025. That was up 6.9% from September and 22.9% from a year earlier, and China's share of total U.S. imports rose to 36.9% from 36.3%.
The leading China-origin categories were plastics at 144,530 TEUs, furniture and bedding at 137,551 TEUs, and toys, games and sporting goods at 102,672 TEUs, according to the full report. Imports from the top 10 countries of origin rose 5.8% from September and 18.5% from October 2025.
East and Gulf Coast ports pick up share
The top 10 U.S. ports handled 84.8% of imports. Houston, Savannah, Norfolk and Charleston all increased volume, while three West Coast ports declined:
- Los Angeles: down 1.4%, or 7,310 TEUs
- Long Beach: down 2.0%, or 10,156 TEUs
- Oakland: down 10.9%, or 8,714 TEUs
Gulf Coast imports rebounded 24.0% to 266,905 TEUs, 16.2% above their 12-month average. Houston's gain of 42,665 TEUs made up about 83% of the region's increase, though Descartes noted that Houston had fallen 16.5% in September, so part of the jump was a recovery from a low base.
Delays creeping up
Port transit delays rose modestly at seven of the 10 gateways Descartes tracks. Across those ports, the unweighted average delay went from 4.2 days in June to 4.6 in July, 5.5 in August, 6.0 in September and 6.3 in October, about 50% above June. Descartes measures the delay as the gap between the estimated arrival date on the bill of lading and the date it receives the CBP-processed bill of lading data.
Imports have topped 2.5 million TEUs every month since July. Descartes said no signs of broad-based port congestion have appeared, but that the build-up in delays suggests sustained high volumes "may already be contributing to pressure on the inland logistics network," and that November's data will show whether that pressure keeps building.
"October's record import volume shows that U.S. maritime trade remains strong, even as trade policy and shipping conditions continue to shift," said Jackson Wood, vice president of product management, trade regulations at Descartes.